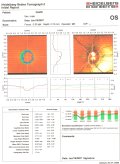
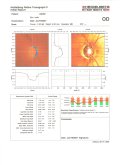
These are my HRT results from today, 19-January-2007. This test was performed with an HRT-II, which is the same model used for my HRT test in 2006. However, today's tests were done by a different doctor (and different HRT operator) -- in fact, they were done in a different country.
Upon a quick examination, the doctor didn't seem to think there was much progression over the last year. However, I expect further input in the coming weeks.
My Left Eye Heidelberg Retina Tomograph (HRT-II) 
My Right Eye Heidelberg Retina Tomograph (HRT-II) 
Click the thumbnail image or the link above to view the full size images
Here is a side-by-side comparison of the numbers. From the numbers, there does not seem to be much change in my left eye over the last 12 months. However, the numbers for my right eye are generally worse today than 12 months ago. Maybe the doctor didn't look at these numbers closely today or maybe the changes are not large enough to concern him. I'm not sure, but I'll post an update when I get more feedback.
| Left | Right | |||
| 2006 | 2007 | 2006 | 2007 | |
| Disk Area | 2.011 | 2.032 | 1.763 | 1.755 |
| Cup Area | 0.876 | 0.905 | 1.131 | 1.243 |
| Rim Area | 1.135 | 1.127 | 0.632 | 0.512 |
| Cup Volume | 0.208 | 0.217 | 0.371 | 0.444 |
| Rim Volume | 0.212 | 0.233 | 0.123 | 0.088 |
| Cup/Disk Area Ratio | 0.435 | 0.445 | 0.641 | 0.708 |
| Linear Cup/Disk Ratio | 0.66 | 0.667 | 0.801 | 0.842 |
| Mean Cup Depth | 0.261 | 0.287 | 0.426 | 0.441 |
| Maximum Cup Depth | 0.707 | 0.71 | 0.801 | 0.813 |
| Cup Shape Measure | -0.213 | -0.162 | 0.025 | 0.043 |
| Height Variation Contour | 0.287 | 0.324 | 0.332 | 0.3 |
| Mean RNFL Thickness | 0.19 | 0.187 | 0.221 | 0.169 |
| RNFL Cross Sectional Area | 0.959 | 0.947 | 1.041 | 0.792 |
| Reference Height | 0.333 | 0.412 | 0.48 | 0.47 |
| Topography Std. Dev. | 13 | 10 | 11 | 19 |
It is probably worth noting that my IOP was higher for most of 2006 than it is right now. Hopefully, the next HRT and/or GDx will not show further loss of RNFL thickness.
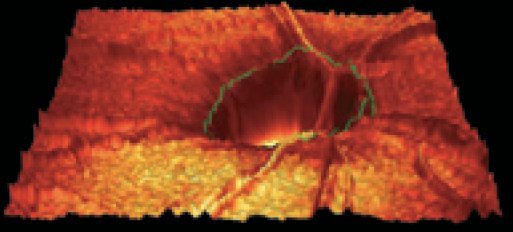
 UPDATE 26-January-2007. When I had this HRT test done, the technician showed me how the contour line is drawn. This contour line is shown in green on the image. This line has to be manually drawn by the technician.
The process of drawing the line involves selecting four points at the edge of the disc -- and having the skill to differentiate this from areas of peri-papillary atrophy, for example. Once the four points are selected, the software draws the green contour line. The technician can then flip the 3D image over (so the cup looks like a mountain) and visually inspect the contour line. If it doesn't look satisfactory, the technician can make adjustments and then check it again. The technician showed me how different selection points altered my analysis. A different technician had performed my prior HRT, and this technician ultimately agreed that the prior contour line (as defined by the 4 selection points) was good and she replicated those selection points for this test.
This contour line is used by the HRT software to calculate whether the disc is suspicious or not. In following glaucoma progress over time, the most important element in regard to this contour line is just consistency. It doesn't have to be drawn perfectly - but it should be drawn the same way every time. It helps if the same technician performs all HRT tests for you.
Copyright notice - Copyright (C) 2007 FitEyes.com. Do not use these images without my permission. Thanks.
Filed Under (tags):
- dave's blog
- Log in or register to post comments

