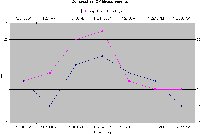
I found this data interesting. It hints that I sometimes have eye pressure changes related to postural changes. In the chart below, you'll see that my eye pressure went from 17 to 23 to 17 very quickly after I went from lying down to standing (and then sitting).
Here is how this data was collected: I got home from the airport on 12/9/06 and took an eye pressure measurement at 7:06 am. Then I took a nap because I had not gotten much sleep the night before. After getting up from my nap, I stood up, walked quickly to another room (which required about 15 seconds), sat down and checked my eye pressure. Each eye pressure measurement was taken about 20 seconds apart and I alternated eyes according to the times on the X axis of the graph shown below.
The measurements were taken with the Reichert AT555 non-contact tonometer. (If that concerns you, please read How Accurate Are My Eye Pressure Measurements? or see the Tonometers forum. An AT555 is not the ideal instrument for researching the type of eye pressure changes that happen quickly upon postural changes, but if you aren't aware of how good the Reichert AT555 is in comparison to other tonometers, including the GAT, you may feel more comfortable with these numbers after reading the tonometer research.)
Click on the thumbnail to see a full size chart. 
December 9th is the first time I really noticed a trend like this. However, once I recognized this trend, it appeared that it is present in prior data. For example, on 12/3/06 after going from lying to standing to sitting, my eye pressure values were 17, 22, 16 at 20 second intervals.
Therefore, I decided to look a little closer at this phenomenon.
On 12/10/06, I took 3 eye pressure measurement consecutively after going from lying to sitting without standing up and walking first, as I had done on all the prior measurements cited above. The eye pressure values, collected 20 seconds apart, were:
18 16 18
So, it appears the intraocular hypertension curve shown above was not present this time. That reinforces the idea that more dramatic postural changes (such as standing up after lying down) affect my IOP.
Next, on 12/12/06, I repeated the original scenario of lying down, standing up (walking) for about 15 seconds, and then sitting down to have my IOP checked. Collecting the 9 values below required approximately 4 minutes. In this case, the eye pressure values resembled the original curve with the increase and a return to the baseline. The consecutive eye pressure values were:
18 17 21 20 21 22 21 21 16
For the next test on 12/15/06 I again repeated the original scenario of lying down, standing up (walking) for about 15 seconds, and then sitting down. The eye pressure values again resembled the original curve with an increase followed by a return to the baseline. The consecutive eye pressure values were:
16 17 18 16 17 13
The last test in this series was done today, 12/16/06. I repeated the original scenario of lying down, standing up (walking) for about 15 seconds, and then sitting down. Once again, the eye pressure values increased and returned to the baseline. However, this time the change occurred over a longer period of time. The 18 values below were collected over a period of 10 minutes.
18 22 23 24 24 21 23 22 24 24 20 19 21 21 22 18 18 16
This bell-curve shaped eye pressure trend doesn't happen every time I go from lying to standing, but the data indicate that it doesn't happen frequently. With methods designed to catch this phenomenon, it might be even more frequent than we currently think it is. [Update: I suspect the large intraocular pressure changes upon postural change are associated with greater relaxation including a lower heart rate and lower blood pressure. Standing up when my heart rate and/or blood pressure are low seems to produce a large increase in my intraocular pressure. Standing up if my heart rate and/or blood pressure are normal does not seem to increase my intraocular pressure.]
I can't offer any further comments on this phenomenon because I don't have any more information. However, one of my doctors pointed me to the study described below. I don't have normal tension glaucoma, but my results seem to agree in general with the results of this study. Furthermore, the intraocular pressure hypertension curve shown above usually only happens in my right eye (although it sometimes appears in my left eye too). My right eye has much more severe optic nerve damage as you can see here or here.
It seems to me that this is an area ripe for further research. For now, all I can do is pass along the article my doctor referenced:
Volume 113, Issue 12, Pages 2150-2155 (December 2006)
Relationship of Progression of Visual Field Damage to Postural Changes in Intraocular Pressure in Patients with Normal-Tension Glaucoma
To evaluate whether postural changes of intraocular pressure (IOP) are associated with progression of visual field damage in patients with normal-tension glaucoma (NTG).
Prospective, noncomparative, nonrandomized study.
Sixty eyes of 33 patients with NTG.
Intraocular pressure, blood pressure (BP), and pulse rate (PR) were measured in both sitting and supine positions. Visual fields were examined using Humphrey Field Analyzer (HFA; Zeiss-Humphrey Instruments, Inc., San Leandro, CA). Changes in mean deviation (MD) per year (dB/year), that is, MD slope, were calculated by linear regression analysis of the HFA Statpac 2 program.
The relationship between postural changes of IOP and MD slope was analyzed. The correlation between postural changes of IOP and cardiovascular parameters such as BP and PR also was analyzed.
The IOP in the supine position was significantly higher than that in the sitting position (P<0.001, paired t test). There was no significant correlation between MD slope and sitting IOP (Pearson r = 0.172; P = 0.188), but a significant correlation was found between MD slope and supine IOP (r = −0.261; P = 0.043). The MD slope significantly correlated with IOP elevation caused by the postural change (r = −0.682; P<0.001). The systolic BP in the supine position correlated with postural changes of IOP (r = 0.364; P = 0.004), but other cardiovascular parameters did not correlate with IOP parameters.
The progression of visual field damage in NTG is associated with IOP in the supine position and the magnitude of IOP elevation accompanying postural changes. These results suggest that deterioration in NTG may occur when patients are lying flat during sleep.
Filed Under (tags):
- dave's blog
- Log in or register to post comments

